
What's New? - November 2022
Another month and it's time for another update :)
We've been busy lately working on a number of improvements for Report Toaster, one of which involves the ability to create new metrics that can combine data between two different types of reports.
The potential here is pretty incredible, as it really lets you push the limits of what's possible with Shopify's dataset.
Let's take a look at an example of this in practice.
Live Inventory on Sales Reports
As many of you know, Shopify's Sales Reports display what's true at time of sale (meaning the information displayed is accurate at the time the sale was made).
Conversely, Inventory reports display what's true in your store right now (meaning they reflect live inventory data).
But what if we could combine the two?
Namely, what if we wanted to see current inventory quantity on a historical sales report?
Well, now we can! In fact, here's a report we set up specifically to do that for one of our customers:
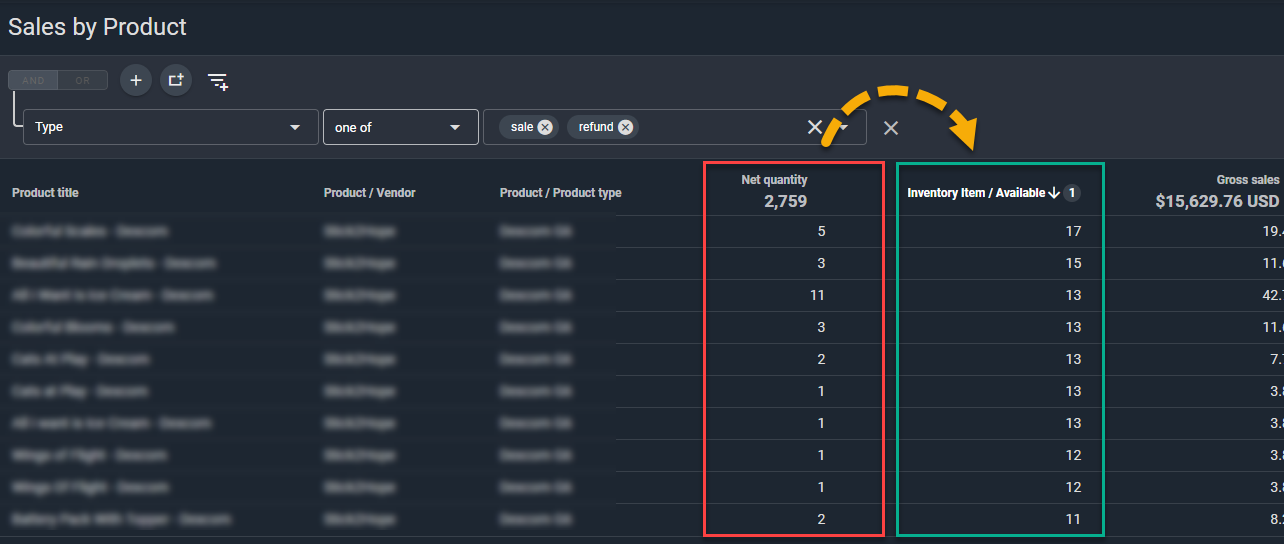
(click image to enlarge)
Using this data, they could see exactly how much of each item sold (Net Quantity) and compare it to what's currently in stock (Inventory Item / Available).
This would work for any sales report that uses Products or Variants. At their request, we also added this data to our Product Pick List report.
As you can imagine, having this information on hand is very useful when handling fulfillments.
So what we did next was group all products by variant, filter to show only unfulfilled or partially fulfilled orders, and provide a report that lets them directly compare Available vs Fulfillable Quantity side-by-side in the same report.
This was the end result:
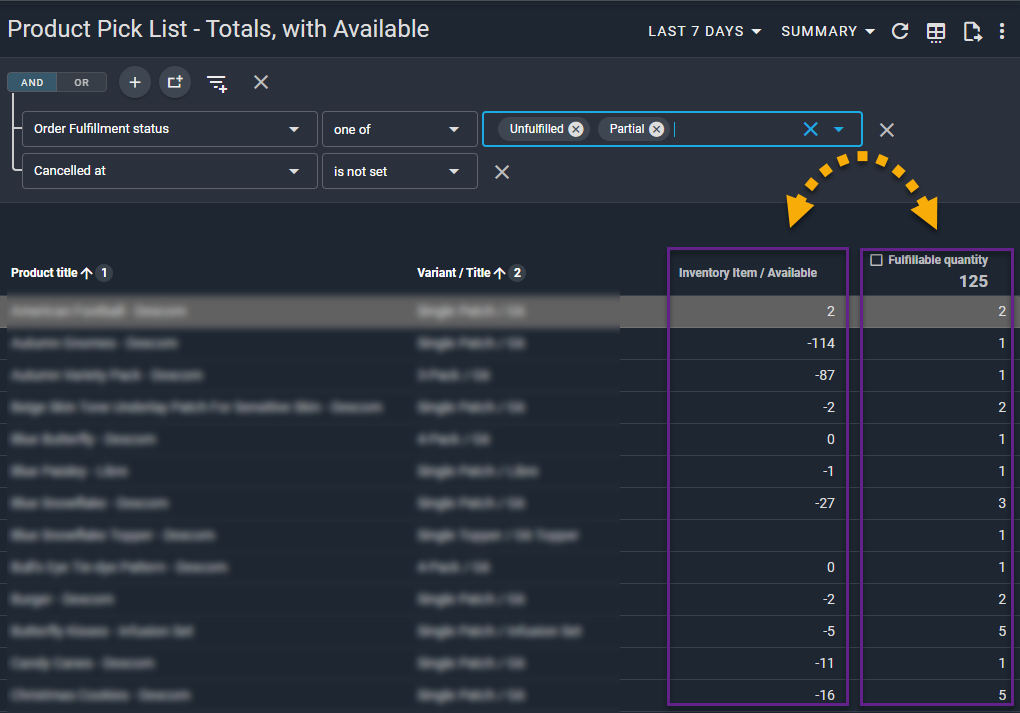
(click image to enlarge)
Of course, it's not just the metric itself that's interesting — it's all the possibilities that are unlocked simply by having access to this data.
Sell Through Rate
So what sorts of things can we do now that we have live inventory on a historical sales report?
Let's start with calculating Sell Through Rate (STR).
For that we need a simple formula:
Sell Through Rate = Quantity Sold ÷ (Inventory Available + Quantity Sold) × 100
Here's a sample we set up for one of our merchants:
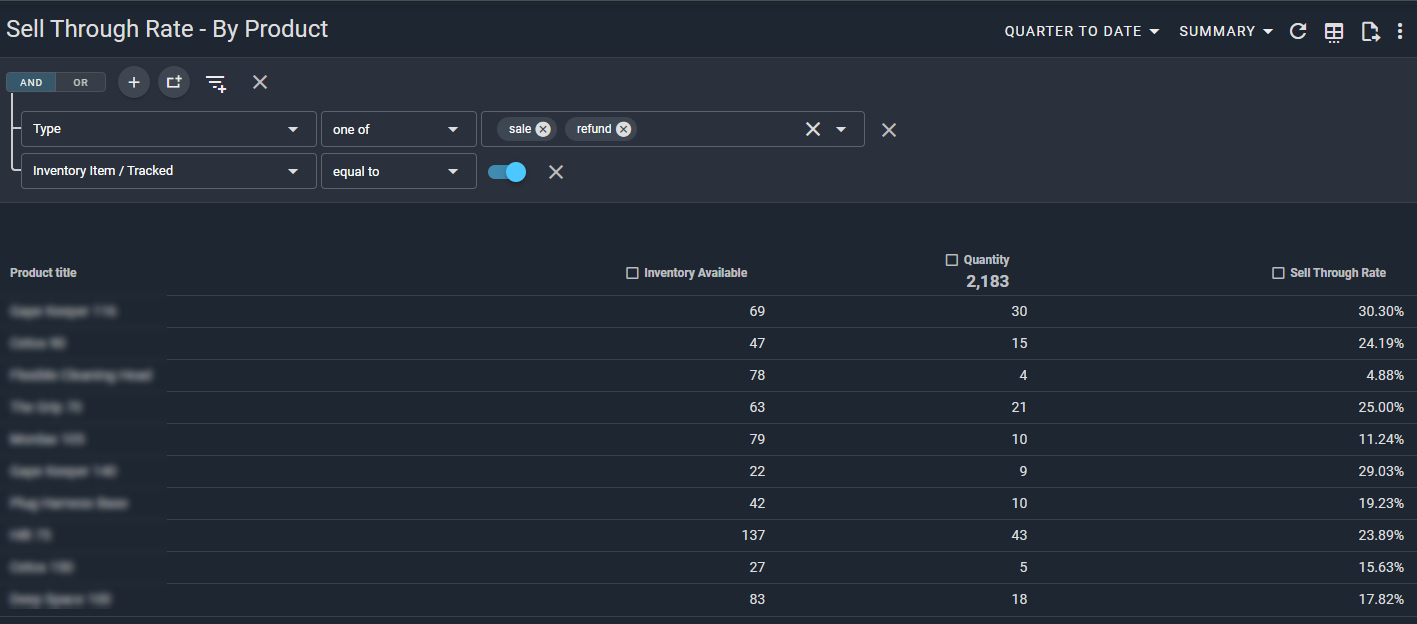
(click image to enlarge)
Once the Sell Through Rate metric has been set up, you can include it on a number of different sales reports as well — Sales by Channel, Sales by Vendor, and so on.
Pretty exciting stuff.
Daily Quantity Sold / Days Remaining
Of course, there are lots of other ways to combine data points under this new system.
For instance, once you know how much you've sold over a given period (for example the last 90 days), you can calculate the daily average.
Daily Quantity Sold = Quantity Sold ÷ Number of Days in the Period
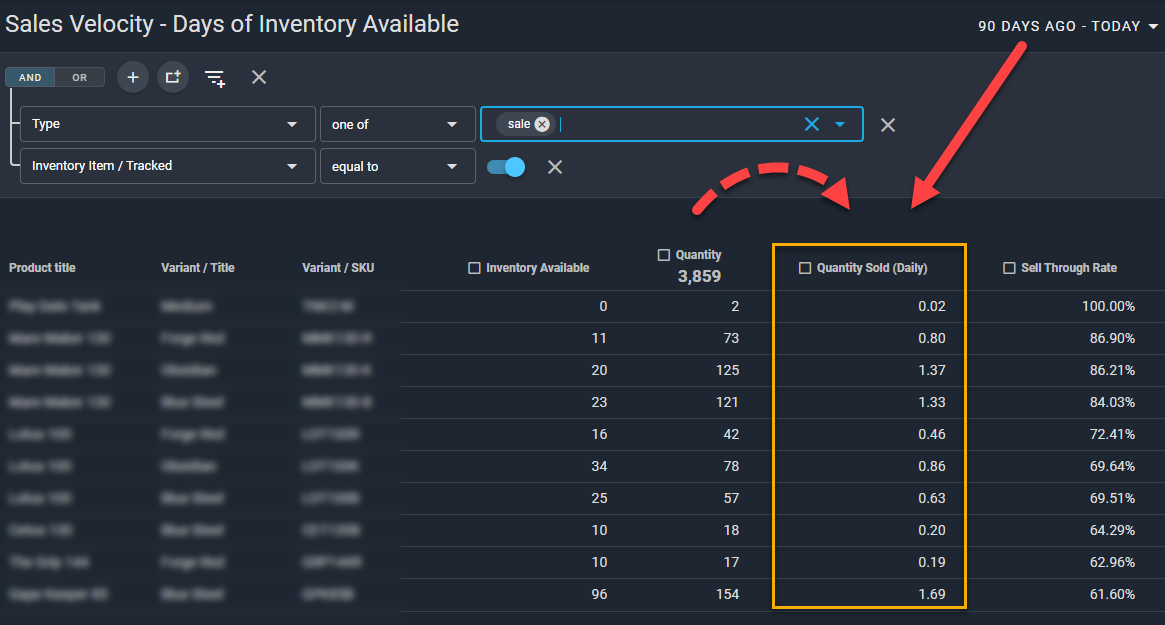
(click image to enlarge)
Once this field is set up, you can even sort by this column to see which items sell the most on any given day.
Now let's combine that with Inventory Available to calculate Days of Inventory Remaining.
Days of Inventory Available = Inventory Available ÷ Daily Quantity Sold
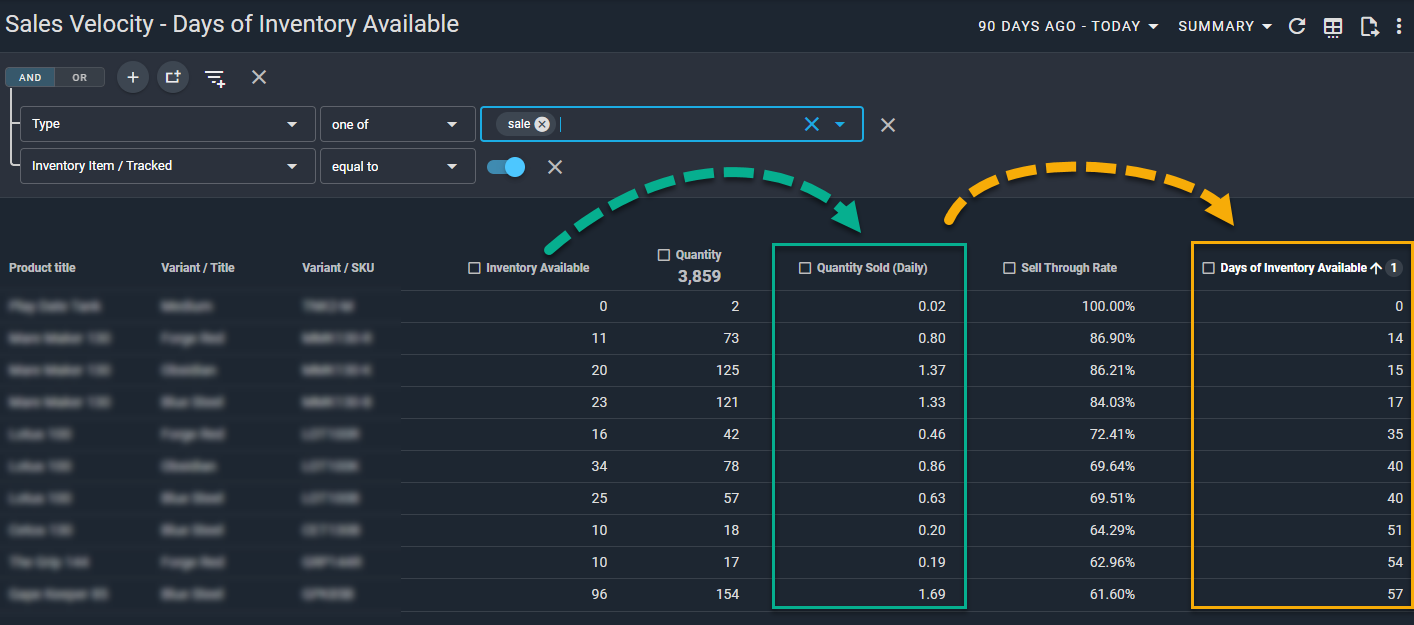
(click image to enlarge)
With a report like this, you can predict how long your current inventory will last (assuming current stock levels) and quickly identify which items need to be prioritized when re-ordering.
Pretty cool stuff!
Note: These new metrics require a paid subscription to Report Toaster. You can sign up at any time by visiting https://reporttoaster.cloudlab.com/subscribe.
If there's another report or field you'd like us to create for your account, feel free to email us at [email protected]. You might be surprised with what we can come up with!
Until next time!